Another podcast this week.
And if you are getting this post twice this week I apologise as we are in Ireland at present and of course Murphy’s Law kicked in and things have go awry.
It is amazing what you can fix, and access, on the run these days, especially have a few pints of the black stuff!
All subscribers get to listen to my dulcet tones this week.
Also an edited transcript is below.
This week I want to talk about the rental market across Australia, what's going on with the vacancy rate plus rents and what's likely to happen into the future.
First, we're seeing vacancy rates stabilise and in recent years even start to increase a little bit. On average across Australia the vacancy rate is 1.3%.
Now people will argue that 3% is a balanced market. I've been saying for some time that it's closer to 2% because of the way that tenants particularly source rental properties these days. It's via friends, digital platforms and through social media.
Gone are the days when you went to the real estate agent, picked up a list of rentals out the front of their office; drove by those homes available for rent and then went back to the office and were accompanied by a leasing staff member as they showed you the digs you were interested in.
That was the analogue world!
So, anything between 2% and 3%, I think, is a balanced market and that was the case for much of the 2010s. And during that time weekly rents were largely stable.
Today we've got about 41,000 properties available for rent across the country. And that used to be somewhere around 80,000 per year between 2010 and 2020. So, we have seen a big contraction back.
We have seen in recent years a slight increase on the amount of vacant property available for rent but not enough to make any real dent in rental growth.
I don't think there is going to be a stabilisation in rents anytime soon particularly as we struggle adding new investment housing supply.
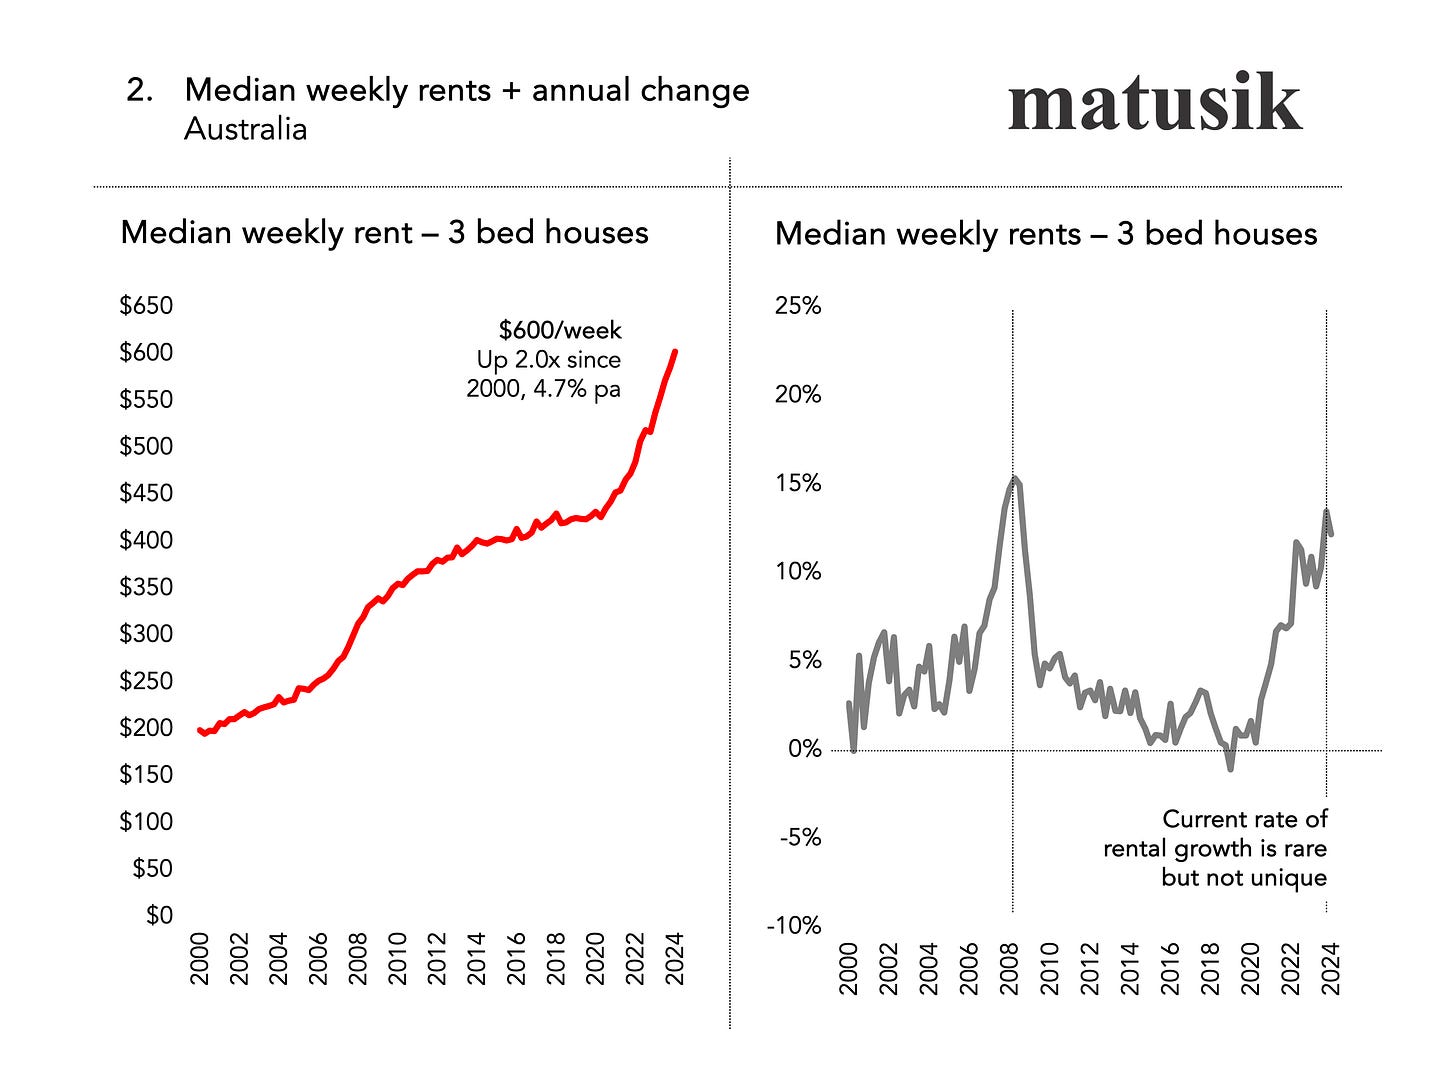
When looking back to 2000 – using the Sydney Olympics as a benchmark - we've seen that weekly rents for three-bedroom detached houses have increased by 200% since 2000 and the current median rent is $600 per week.
The chart above also shows that there has been past periods where rents have also increased sharply. For example this happened during the 2006 to 2008, period prior to the GFC.
This past rental surge was also due to a shortage of rental stock but also a swell in population growth particularly as Australia was having a mining boom at that time.
And as we all know rents have been increasing sharply since 2020.
The reason – based on our analysis – has nothing to do a switch to Airbnb’s, more tenants living alone or more investors leaving their rental homes vacant, but the lack of new rental digs being built across the country.
The main culprit here was APRA and their 10% annual cap on the growth in the size of a bank’s investor portfolio. This applied – from memory between 2014 and 2019 – we are now seeing the result of this restrictive behaviour.
Such handcuffs have bite, but they take time to have an impact. And yes, their impact can be huge. A bit like the Pasha Bulker. Slow to turn, even harder to stop.
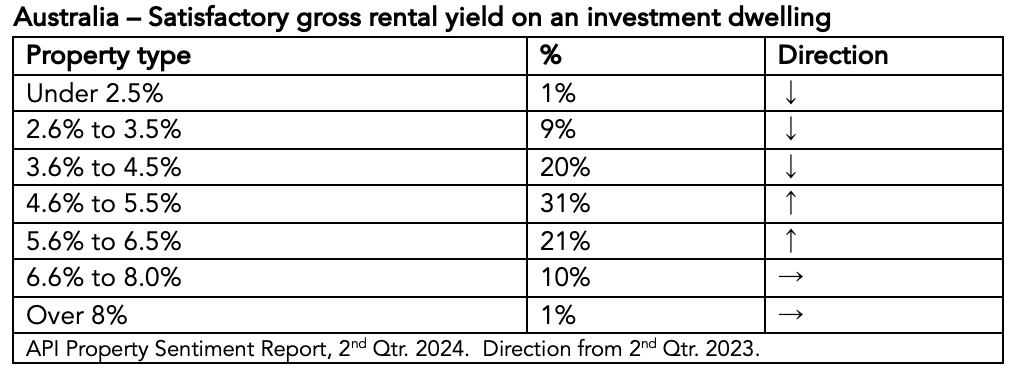
Before we finish today, one of the things that is worth mentioning is the mindset of the investor. Some recent survey work done by the API Magazine found that most housing investors expect a gross rental yield exceeding 4.6%.
Now that's increasingly hard to achieve, particularly as housing prices go up, and whilst rents have increased, they haven't increased enough to cater for that difference.
This is another reason why I think rents have further to climb.
Interestingly - the table included in this missive - shows a reduction in the number of people who are satisfied with a sub 5% annual gross rental return and an increase in those looking for something higher.
This is, in general, is hard to achieve for generic housing stock.
One of the ways to make your investment property perform better in terms of rental returns - plus additional grunt when it comes to potential price growth - is to get more tenants on your title.
We'll talk more about that in a future missive.
Get more!
You may also be interested in getting my Sept. Qtr. Housing Market Overview + Outlook Video.
This 20 minute video holds 33 slides and is free to paid Missive subscribers.
This quarter’s video covers:
Current state of play
Population growth
Reasons behind price growth
Interest rates
Outlook
All charts and tables hold the latest data sets.
Upgrade to paid to access the video and to listen my future podcasts too.
Alternatively, you can buy my Sept Qtr. video for $165 by going here:


Share this post