

Urban land tightens

Short and sweet this week.
Three charts and a table for paid subscribers.
The charts depict significant trends in Southeast Queensland's urban land market.
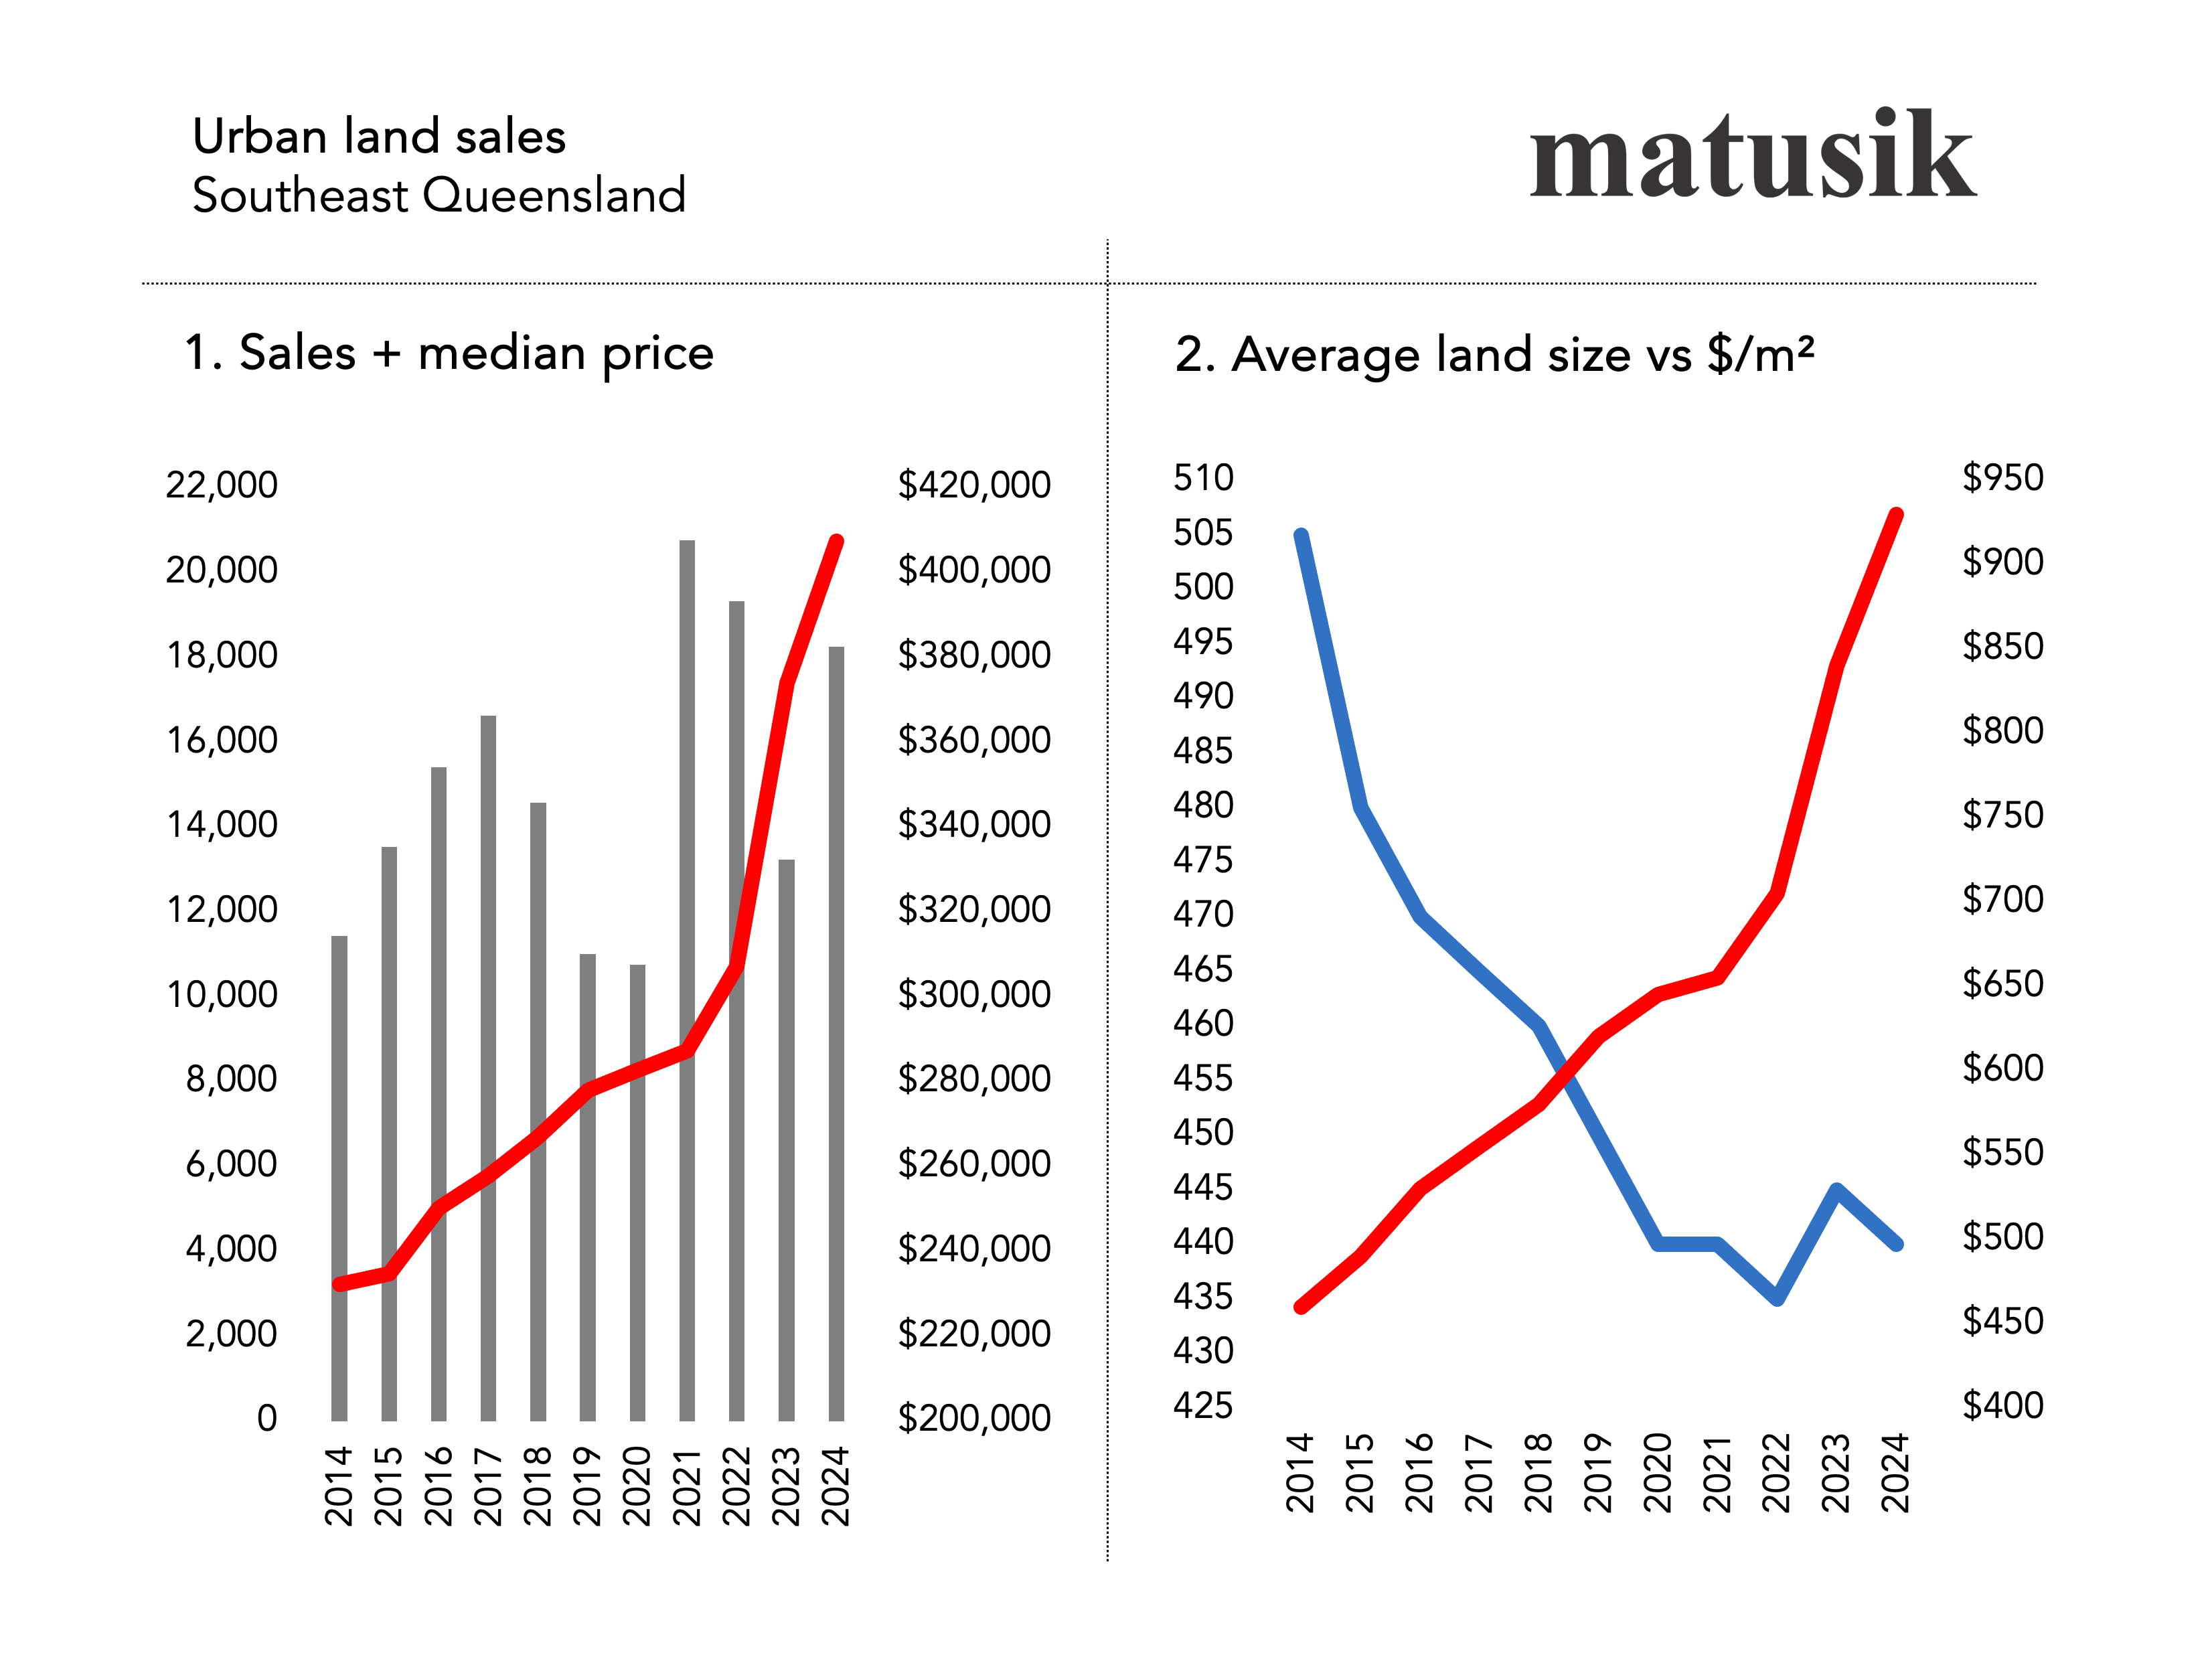
Chart 1 shows an explosive surge in urban land prices, skyrocketing from around $200,000 in 2014 to over $400,000 in 2024, even as sales volumes dance up and down.
Chart 2? It's telling a fascinating story too.
The average land size has contracted from 500m² to about 440m², while prices per square metre have shot up from around $450 to a staggering $930. A doubling in just ten years.
The market is getting tighter, with smaller lots fetching premium prices, reflecting the growing competition for available land and the weighty price tag on urban space.
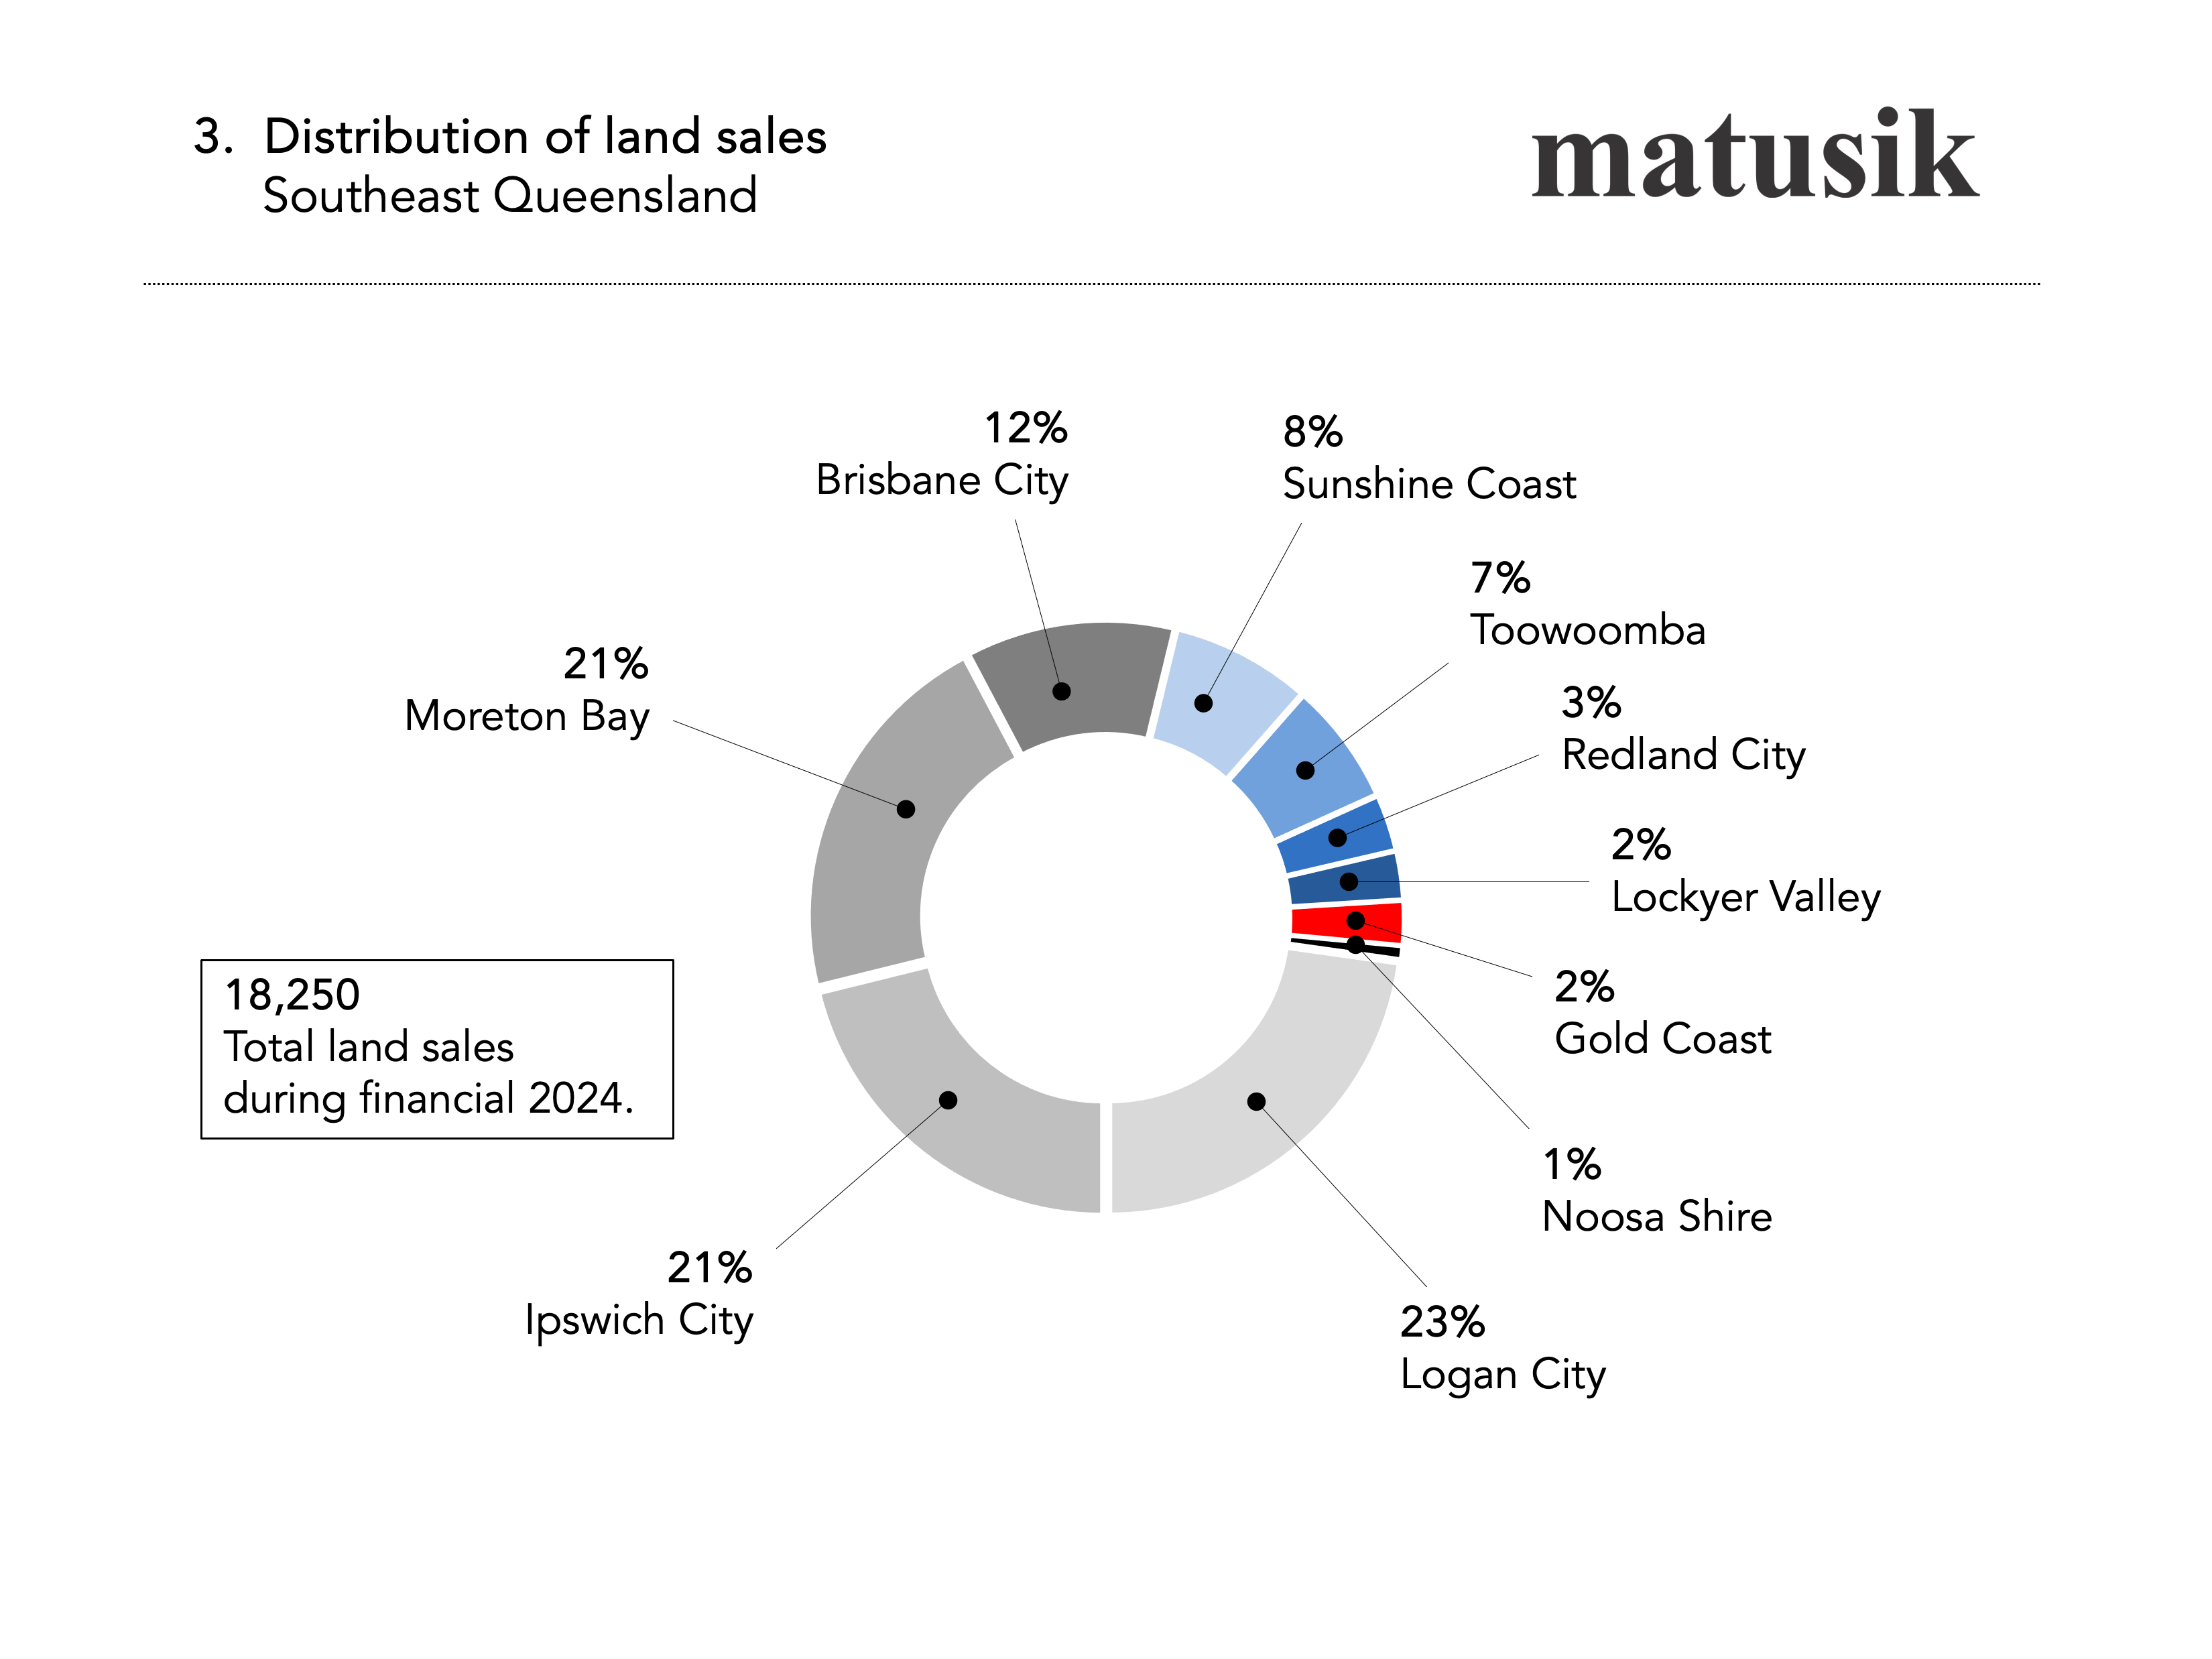
Chart 3 shows the spread of 18,250 land sales this financial year with Logan and Ipswich are leading the charge with a whopping 44% of total sales. Moreton Bay is holding its own with 21%.
But what’s the deal with the Gold Coast?
Despite its bustling population growth, the Gold Coast is lagging with only 2% of total land sales. It’s shocking given the area’s size and the level of underlying housing demand.
This low volume of sales on the Gold Coast highlights the growing supply-demand imbalance in one of Australia's largest urban markets.
It’s time to step up the game, Gold Coast!
Get more and save too!
And for paid subscribers - below the paywall - is a table outlining the pertinent land market details by each LGA across southeast Queensland.
Also paid subs, save 20% on my Ready Reckoner Reports.
Ask Michael
And also, if you are a paid subscriber you get to ask me a question. I will answer these in future missives but only below the paywall. Please leave your question in the comments section. We might all learn something, me in particular.