We are away overseas and before we nicked off, I did as series of presentations across the eastern capitals and Queensland regions.
Some new charts found their way into my spiel.
I have included three of them in this post.
Australia’s housing landscape is shifting and not the way the town planning fraternity, the ‘latte left’ or the social engineers would like.
Detached houses now dominating at 62% of new dwelling completions.
Apartments are losing ground, dropping to 23%, while townhouses hold steady at 15%.
Regional trends vary: ACT's apartment completions spike at 64% - further evidence that Canberra is a world unto itself! - contrasting sharply with Queensland and Victoria's mere 17%.
In short, it’s a clear pivot towards houses.
Why?
Because it is getting too expensive to supply new apartments at what most punters will think offers value for money. Valuers are struggling to supply evidence for bank loans.
Tier 1 builders are scarce as hens teeth these days, so the big apartment buildings aren’t happening. And the many in the building trade could step up to the second tier but then that means possible union thuggery.
Developer’s with a building arm are doing most of the apartment work these days. And there isn’t that many of them downunder.
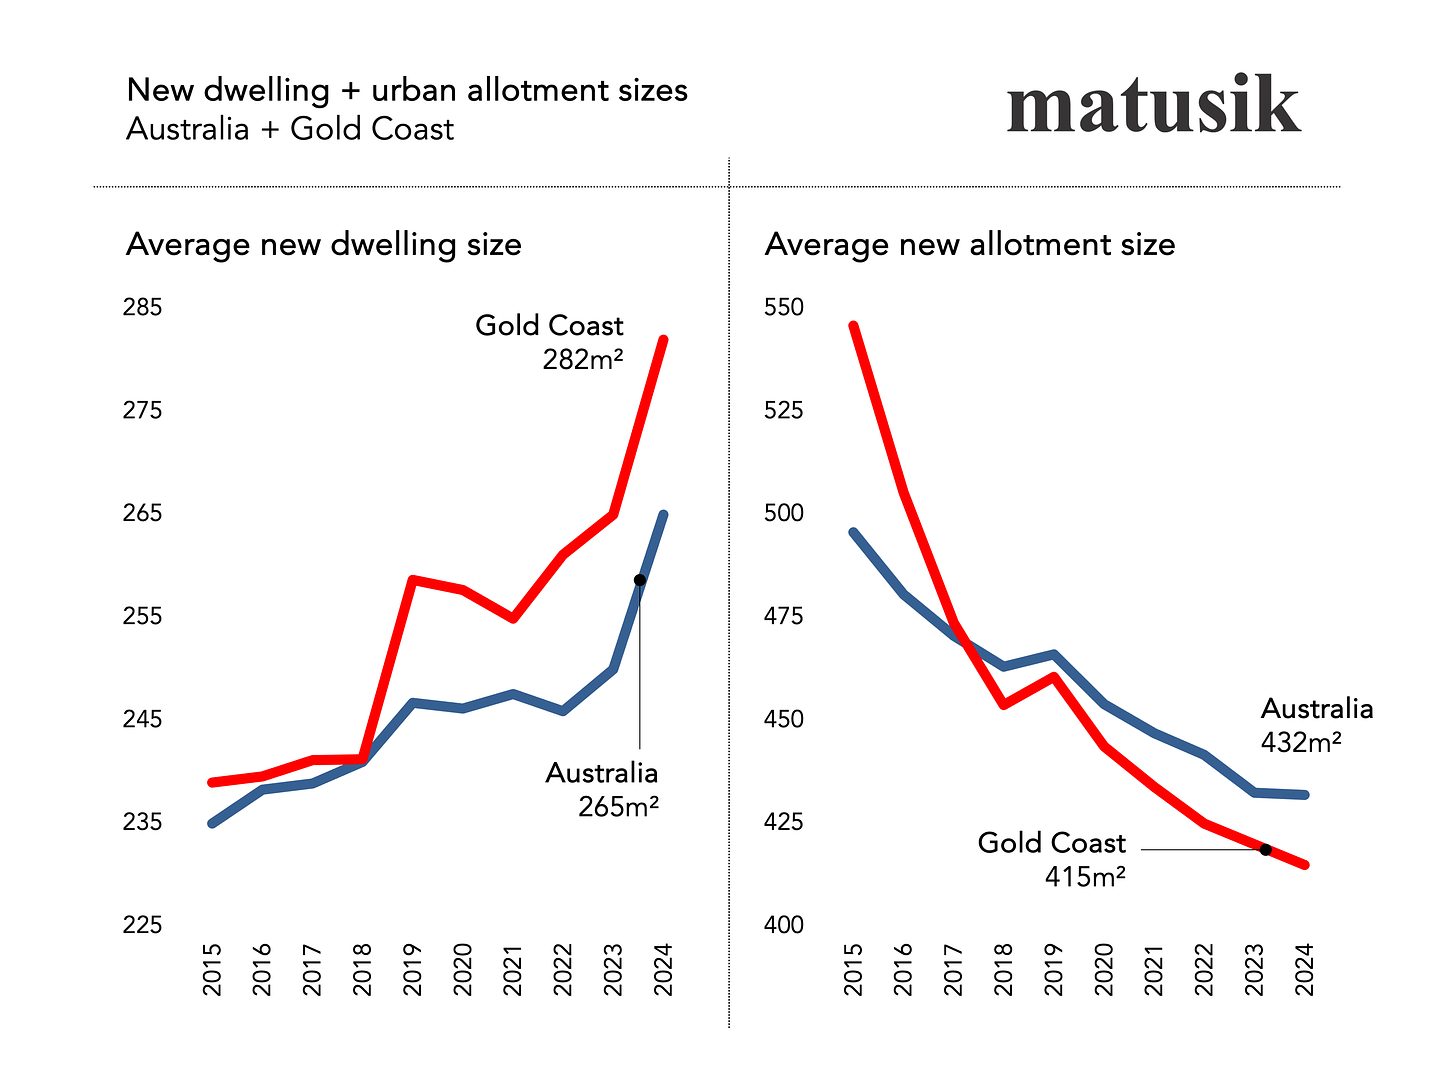
The Gold Coast is bucking the trend: while average allotment sizes continue to shrink across Australia (now at 432m²), the size of new dwellings on the coast has surged to 282m².
It’s a paradox in planning - smaller lots with bigger homes - highlighting a growing appetite for space in a compact world.
Moreover given that 22% of Aussie’s live alone (lucky buggers!) and another 25% live as a couple - coupled with the increasing cost of living and rising dwelling prices and rents – one wonders how long this oxymoron can continue.
Housing finance in Australia is a tale of two trends.
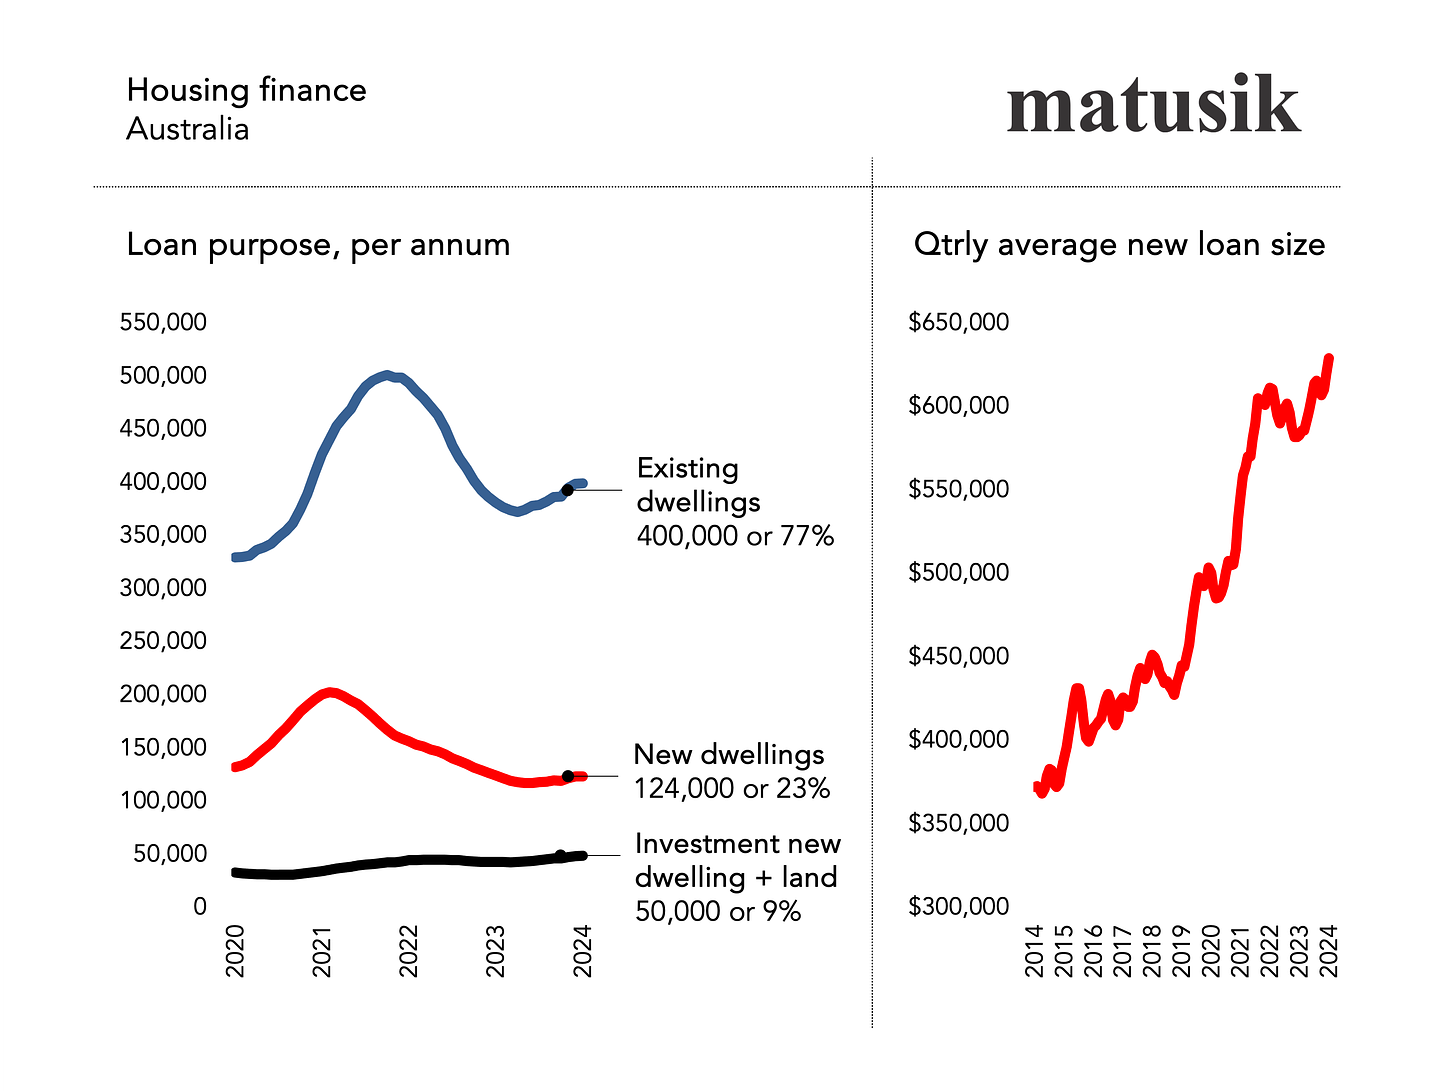
New home loans for existing homes dominates with a 77% market share.
Whilst new mortgages for investment property is lagging, especially when it comes to loans for new housing.
Last year there were just 124,000 home loans for new housing supply.
This is way behind the need to build 187,000 per annum (based on the last decade’s demand) and even further behind the 200,000 new builds needed to cater for the projected 395,000 annual increase in Australia’s population growth over the next decade.
Moreover just 50,000 new loans are currently going towards new investment housing supply. Seems a lot doesn’t it. Yet to just keep the rental vacancy rate steady Australia needs to create some 70,000 new rental digs per annum.
At present supply rates we are 30% behind the eight ball. And this is based on annual population growth at 395,000 per annum and 35% of the residents renting not the current Covid snapback surge in Australia’s population growth.
The federal government’s babble about building some 225,000 new homes per annum is, well, a joke.
Something needs to be done to get more folks to build more new rental homes.
Meanwhile, the average new loan size continues its steep climb, now nearing $650,000.
It’s clear: bigger loans are the new normal, despite fewer takers.
Three ways to get more!
One. Become a paid Missive subscriber
Listen to my podcasts, get more intel and commentary and save on online reports plus watch my quarterly videos for free.
Two. Sept. Qtr. Housing Market Overview + Outlook Video
A 20 minute video holds 33 slides and is free to paid Missive subscribers.
This quarter’s video covers:
Current state of play
Population growth
Reasons behind price growth
Interest rates
Outlook
All charts and tables hold the latest data sets.
Upgrade to paid to access the video and to listen to, the full podcast, and all future ones too.
Three. Matusik Ready Reckoner reports
Some 25 pages of analysis supported by 37 charts/tables featuring:
Executive summary
Detached, attached and land markets
Rental market
Property clock positioning
Population growth and projections
Current and potential new housing supply
Future housing demand by dwelling product type
Key economic indicators
Ten major infrastructure projects
The coverage
Noosa Shire
Sunshine Coast Regional Council
Moreton Bay Regional Council
Brisbane City Council
Redland City Council
Gold Coast City Council
Logan City Council
Ipswich City Council
Lockyer Valley Regional Council
Toowoomba Regional Council
The Investment
The investment per Matusik Ready Reckoner is $165 including GST.
Paid Missive subscribers save 20% by using their saving coupon.
Buying the Box Set will set you back $1,320 including GST. You get all ten (10) SEQld Ready Reckoner reports plus you save 20%. AND you can contact me - via my website - to set up a time to have a 30 minute zoom chat.
Your purchase may also be tax deductible, please check with your accountant.
Below the paywall is the saving coupon for the Matusik Ready Reckoner Reports and my latest quarterly housing market video.


