

A slap


This missive was written about two years ago and at that time this topic was gathering a head of steam.
At that time, and being a bit flippant, it needs a good slapping down.
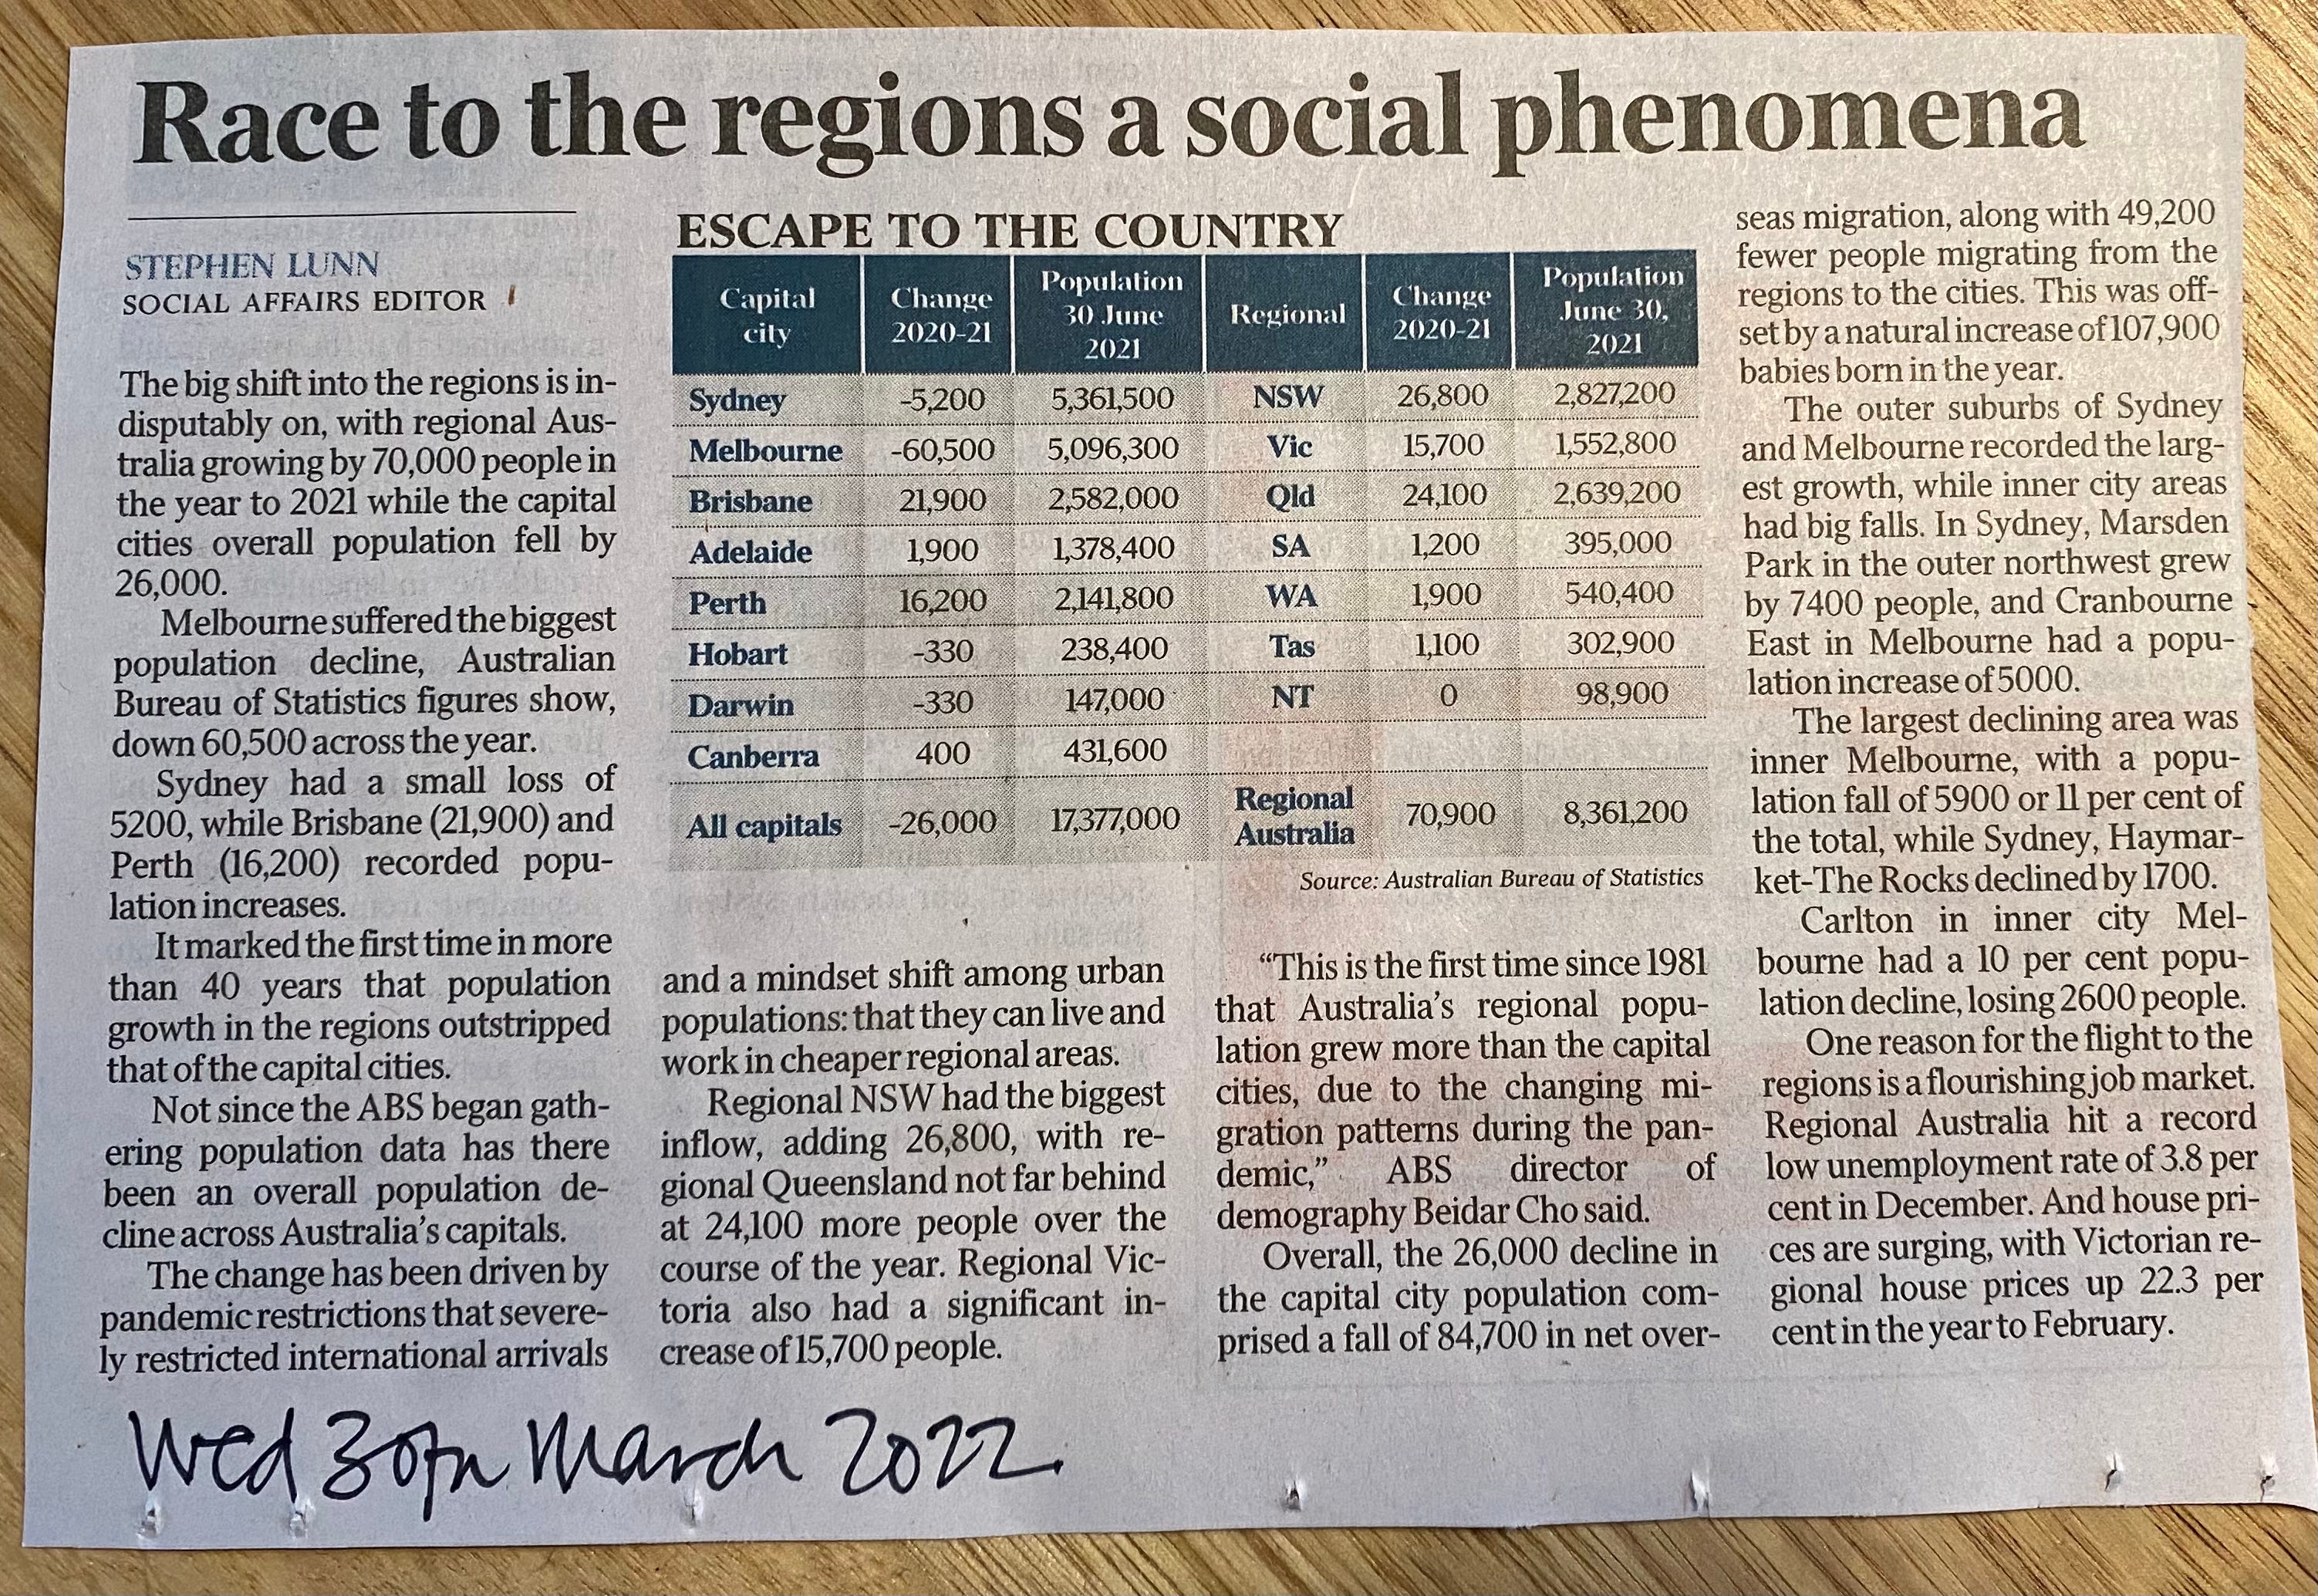
Below is a recent press clipping from The Oz newspaper.
Yet, two years on the BS continues.
Here is what I said back in 2022. And it still rings true today.
There is no race to the regions.
If my recent conversations are any guide, then a lot of people are making real estate buying decisions, on this shallow analysis and associated exposure.
To deliver a much needed smack here, let’s focus on the population growth figures for New South Wales, Victoria, and Queensland.
The table in the media article correctly states that Sydney’s population lost -5,200 people over the twelve months to the 20th June 2021, whilst NSW’s regional locations gained 26,800 peeps.
Melbourne lost 60,500 people yet regional Victoria’s headcount was up 15,700.
And the Brisbane capital region grew by 21,900 folks and the Qld regions rose by 24,100 people during fiscal 2021.
Remember these are ABS figures are around March 2022.
As explained several times over the last two years, much of this regional growth is in the areas immediately adjacent to the major capital city boundaries and more often than not within commuting distance to the big smoke.
In NSW some 38% of the recent regional population growth was in the Newcastle area; followed by 19% in the Wollongong region and another 9% in Richmond/Tweed adjacent to Queensland’s Gold Coast.
Ballarat, Bendigo, and especially Geelong accounted for 70% of Victoria’s regional increase last year.
And in Queensland the Gold Coast held a 35% market share of the state’s regional population growth: with the Sunshine Coast coming in second with 30%.
The next biggest regional Queensland growth market was the Fraser Coast (think Hervey Bay) with a 1,670 population increase – or 7% of the overall regional growth tally – during financial 2021.
In fact, all but three Queensland regions, saw their annual population growth rates fall during 2021.
The exceptions were Mackay, with an 840 increase in 2021, compared to the 300 previous five year annual average. Gympie, up 790 last year, compared with its 680 average and Gladstone, with 335 versus 235.
For mine charts 1 and 2 hammers the final nail in the ‘trend setting’ regional growth coffin.

Chart 1 shows that annual population growth in Australia has plummeted. Again remember this was written in 2022. It is at its lowest level since the first world war.
The big reason for this fall is that overseas migration has stopped due to Covid restrictions. Some 70% of the population growth in our capitals comes from immigration.
Chart 2 shows that big fall in population growth in our major cities and importantly very little change in regional growth numbers.
Our truly regional centres aren’t growing any faster than usual. The absence of overseas migration makes their recent population growth rates look ballistic when compared to our bigger cities.
Despite headlines and the talking heads spruiking otherwise there isn’t really much to see here.
Oh, and both my charts this post – and whilst I would argue such action needs some really careful deliberation – indicates that our annual net immigration intake is about to ramp up and big time.
Thanks for reading to the end of this post. And whilst you are down here why not help me — via a small donation — continue the Missive coming to you.
If you are new to this space - well hello - and click on the button below to subscribe. I’ve been told that the Missive is valuable! All I can tell you is that it is free. Donations of course are welcome. Unsubscribe any time.
And to review my past Missives - some 260 posts between 2018 and 2023 - then visit my business website - www.matusik.com.au - and search away to your heart’s content.
Click on the button below for instant free access!